- Collector Configuration
You need the latest Telegraf version which includes the vSphere Plugin!
On Ubuntu or Debian you can get it with:
wget https://dl.influxdata.com/telegraf/releases/telegraf_1.14.5-1_amd64.deb
sudo dpkg -i telegraf_1.14.5-1_amd64.deb
Now add the following lines to your ‚/etc/telegraf/telegraf.conf‘:
### VMWARE ####

## Realtime
instance [[inputs.vsphere]]
interval = "60s"
vcenters = [ "https://VCENTERSERVER/sdk" ]
username = "USERNAME@vsphere.local"
password = "PASSWORD"
insecure_skip_verify = true
force_discover_on_init = true
# Exclude all historical metrics
datastore_metric_exclude = ["*"]
cluster_metric_exclude = ["*"]
datacenter_metric_exclude = ["*"]
collect_concurrency = 5
discover_concurrency = 5

# Historical
instance [[inputs.vsphere]]
interval = "300s"
vcenters = [ "https://VCENTERSERVER/sdk" ]
username = "USERNAME@vsphere.local"
password = "PASSWORD"
insecure_skip_verify = true
force_discover_on_init = true
host_metric_exclude = ["*"]
# Exclude realtime metrics
vm_metric_exclude = ["*"]
# Exclude realtime metrics
max_query_metrics = 256
collect_concurrency = 3
2. Download Grafana Dashboard
You can download the dashboard from: https://grafana.com/grafana/dashboards/8159
After downloading import it into your Grafana installation.
3. Piechart
This Dashboard uses the Piechart plugin for Grafana. You can install it with:
grafana-cli plugins install grafana-piechart-panel
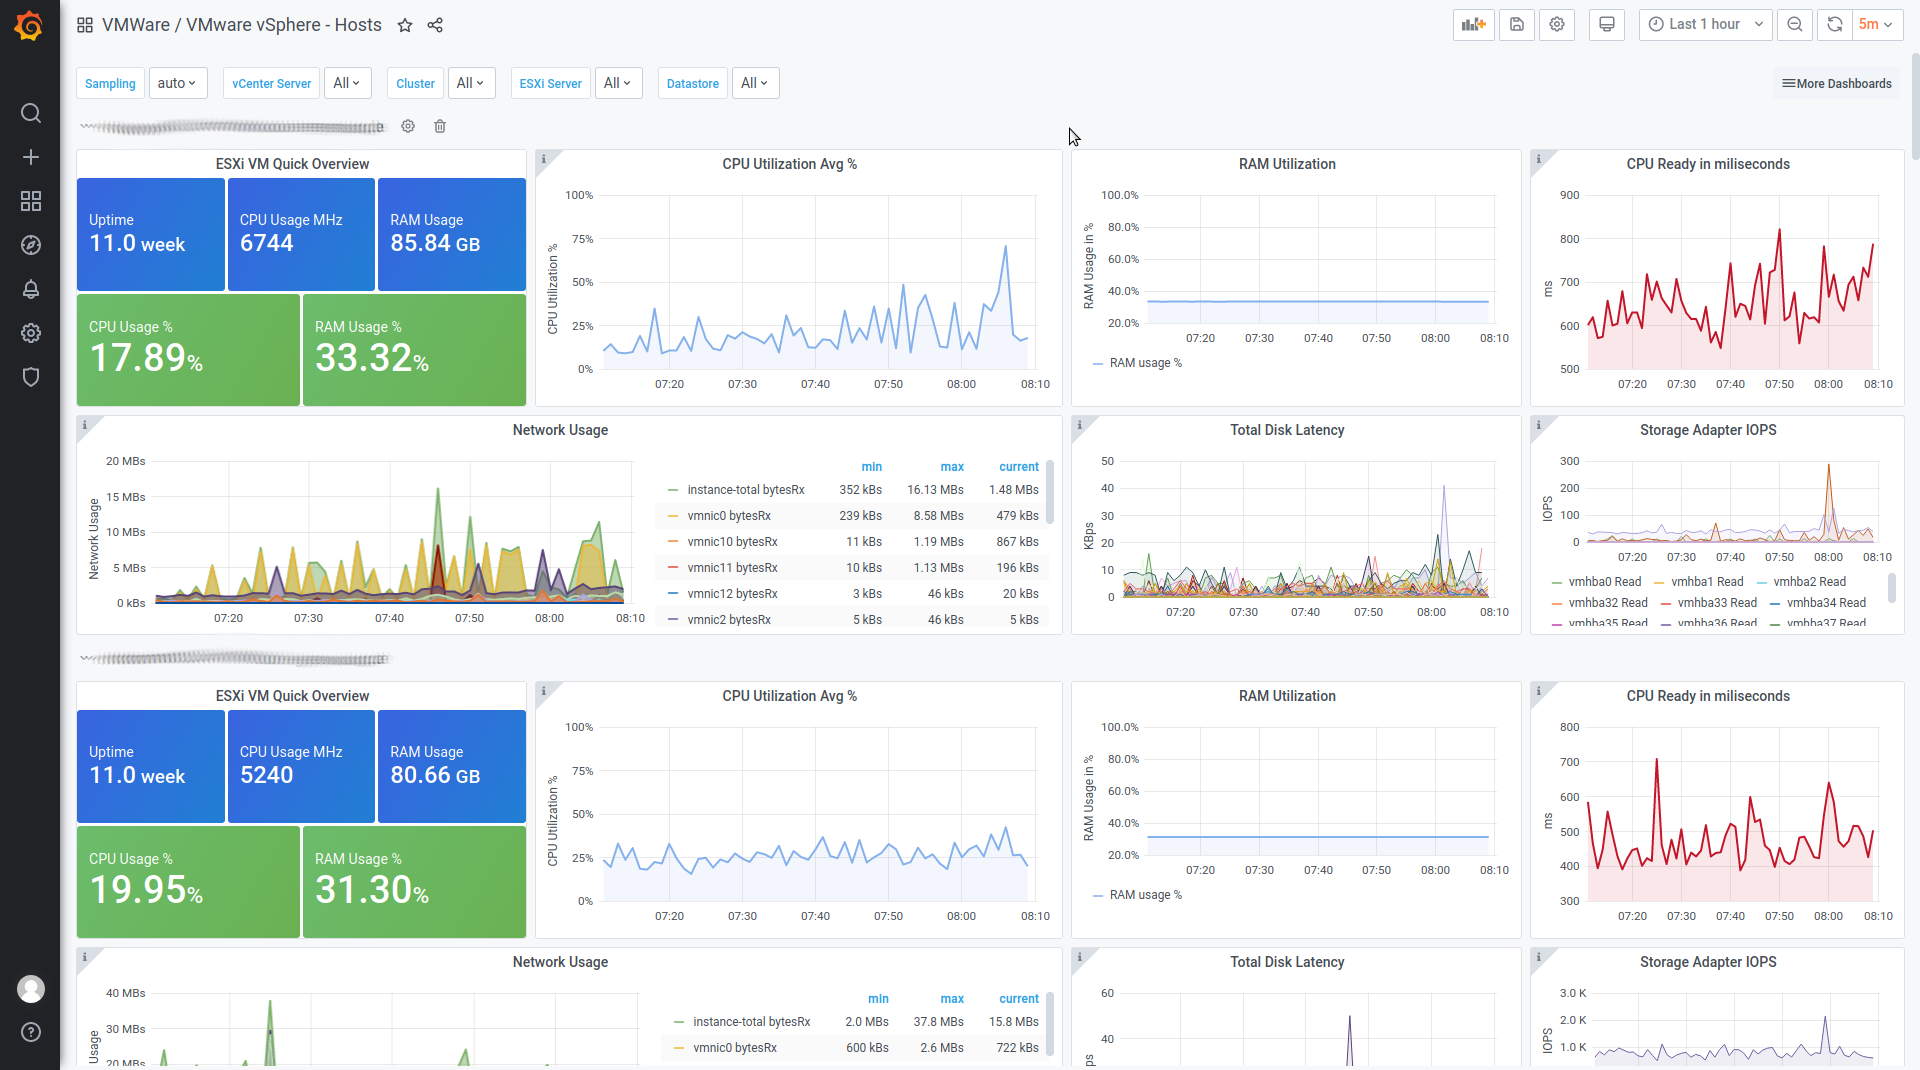
4. Screenshots
If all works you should see something like this:


